Contribution Analysis Report
Content also available for tax entities or on our global site.The Contribution Analysis Report displays how each holding inside a Sharesight portfolio contributes to the overall portfolio performance. The contributions are shown in both a dollar and percentage figure.
The report works excellent in combination with the Sharesight Custom Groups feature. The Custom Groups feature allows for asset allocation based on the portfolio owner’s preferences. The Contribution Analysis Report in turn shows how each asset allocation has performed in comparison to the other asset allocations in the same portfolio.
Note: This functionality is available on Expert and Sharesight Pro plans.
Embedded content: https://www.youtube.com/watch?v=tJobW0R7hBw
Utilizing the Report
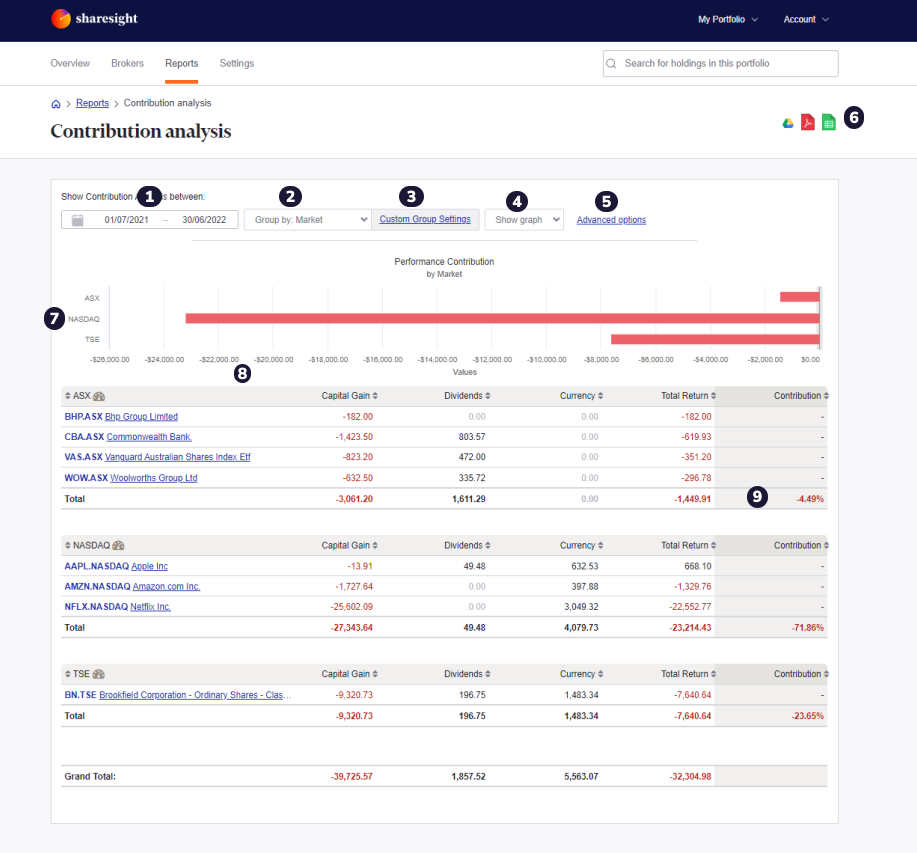
- The date range settings: click to expand and select your date range preferences.
- Group holdings with any of the 7 pre-set options: market, currency, sector classification, industry classification, investment type, country or no grouping. Alternatively group by any of your Custom Groups.
- Create, edit or delete any Custom Group to use as a filter for the Contribution Analysis Report.
- Choose to show or hide the Contribution Analysis Graph.
- Click here to include or exclude your closed positions on the report.
- Download your report as a PDF, CSV or Google Drive document.
- The name of the asset allocation: the name changes if you change the “Group By”.
- The dollar amount the asset has contributed or deducted from the overall portfolio performance.
- The contribution of the asset to the overall performance in a percentage figure.
Last modified on April 30, 2024 UTC